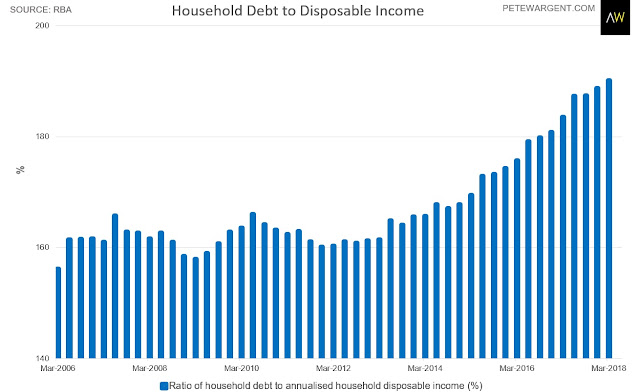
Debt 1.9x income
There was a flurry of excitement back in January when previously reported 2017 figures implied that Australia's household debt pile had temporarily nudged against twice disposable income.
However, the headline number was subsequently revised down.
The latest ratios from the Reserve Bank of Australia (RBA) show household debt now sitting at at 1.9x disposable income.
Or 190.13 per cent as at March 2018, to use a bit of false precision, up from 183.51 per cent a year earlier.
There's a lot of debate about what this debt ratio should or shouldn't be.
It will probably remain higher than was previously normal given the structure of Australia's population and immigration profile, with policy generally taking a keener regard of interest payments and serviceability.
Although this is a revised series high, the rate of increase has slowed somewhat (while the gross figure also doesn't account for the record mortgage buffers and use of offset accounts racked up through this cycle).
Moreover, given the precipitous drop in both the stock and flow of interest-only mortgages the ratio is likely to peak relatively soon as income growth also moves beyond the nadir.
Anecdotally lenders are making it very difficult for brokers and borrowers to see loans written at the present time, which I believe will see the seasonally adjusted monthly value of investment loans pushed down to around $10 billion by the middle of the year, from nearly $15 billion at the 2015 peak.
Money growth is now at its lowest level in 26 years, and investor credit growth is at a record low of just 2 per cent, even before accounting for headcount growth and inflation.

