Sunday, 22 September 2019

Easy like Sunday morning

Easy street

A quick slightly deeper dive into the August jobs numbers this Sunday morning! 

Interest rates rarely seem to be out of the news these days, and parts of the financial media has taken to referring to monetary policy as 'easy', or sometimes even 'ultra-easy'.

The evidence, however, suggests that interest rates are low when money's been tight, not easy. 

As Bernanke himself has said, interest rates and the money supply aren't reliable indicators of the stance of monetary policy, while rates have tended to be low during depressions, and high during periods of hyperinflation.

Unemployment was falling for a number of years in Australia from 2015 to 2018, which at the time justified the stance of policy. 

But as tighter lending brought the housing construction boom to an end, unemployment is now rising, and a jarring slowdown of growth in the economy has led to pointed criticism of the Reserve Bank for persistently undershooting the inflation target over a number of years. 

Participation, sport

What's confounded observers and forecasters alike has partly been an explosion in the size of the labour force.

Having plodded along for some years, growth in the labour force suddenly exploded into life from 2017 onwards, and has increased by more than 600,000 in the past two years alone, from 13 million to well above 13.6 million. 

Australia's participation rate began calendar year 2017 at 64.7 per cent, and now sits at the highest level on record at 66.2 per cent, largely driven by New South Wales and Victoria. 

As such, even historically solid jobs growth hasn't been enough to make lasting inroads into the unemployment rate, while the leading indicators have almost unanimously cratered. 

To wit, three charts. 

Firstly, the good news: New South Wales saw its unemployment rate tick down to 4¼ per cent in August. 

No too much wrong with this chart!


Alas, the same cannot be said of Queensland, South Australia, or Tasmania, where unemployment rates are running between 6 and 7 per cent. 

Unfortunately the number of unemployed persons in Australia is no longer falling; and indeed it has been trending higher throughout calendar year 2019 to date. 


Thirdly, and finally for today, mirroring flaccid trend growth in the number of monthly hours worked, the twin measures of underemployment and underutilisation have also begun to lift again. 


For the youth labour cohort, the underutilisation rate is punishingly high at about 30 per cent.

While comparing measures between countries is always a bit dubious, international experience suggests that a return to more robust wages growth remains unlikely while so much slack is in evidence.

Little fiscal respite

There's not much sign of the government loosening the purse strings meaningfully, hence markets are pricing Australia's cash rate falling to 0.50 per cent in due course, commencing with a 25 basis points cut on October 1 in Melbourne.


Economists calling for an October cut range from Bill Evans at Westpac, to NAB, ANZ, Commsec and the CBA, AMP, Citbank, Goldman Sachs, and others. 

Usually, when the major banks are calling for a cut, it happens. 

It's not as though the jobs market has been running horrendously - annual employment growth is still tracking at +2.46 per cent up until August - but the forward-looking indicators have deteriorated sharply. 

The detailed labour force figures will be released on Thursday this week, and will add some further texture at the industry and regional levels. 

Saturday, 21 September 2019

Weekend reads

Must see articles

This week: a look at population growth, and the biggest auction weekend of the year so far.

See here or click the image below:


By the way - you can subscribe for the free podcast here!

Friday, 20 September 2019

Is this a V-shaped recovery?

V-shaped bounce

For parts of the housing market, maybe so.

See here for more (or click the image below):


Mapping the death of the construction boom

Apartment gluts

Quarterly dwelling starts fell to just 43,000 in the first quarter of 2019, down from more than 58,000 a year earlier. 

We don't yet know the figure for the June quarter of 2019, but given it was election time, I expect the figure will have cratered even further.

Now we have some more up-to-date population estimates, let's take a quick look around the traps at dwelling supply versus underlying demand.

Of course there is much more to housing demand than simply population growth, but it's a decent proxy over time. 

In New South Wales there was a long period of under-building from 2006 to 2012, followed by a veritable starburst of new apartment buildings.

Population growth has accelerated over the years, and unit starts are only now crashing lower - overall, of all the cities Sydney has the biggest apartment overhang to work off. 


In Melbourne, recent population growth is a little under-counted, and the pace of construction has remained by and large in line with the monstrous rate of headcount growth.

I expect to see a rental shortage to transpire here in time:


Queensland has a higher ratio of population growth to dwelling starts than either of the two most populous states, and the Brisbane rental market has been steadily tightening for a couple of years, after a wild period of over-building which peaked in 2016. 


Interesting trends.

With both finance and apartment pre-sales now so much harder to come by, new dwelling starts may well fall by about 60,000 per annum from the peak. 

Glitch in the matrix

Population growth still ~400,000

Australia's estimated population growth ostensibly 'slowed' to +119,000 in the first quarter of 2019, apparently bringing the annual pace down to +389,000. 

However, upon closer inspection this was partly due to further processing delays for births in Victoria, which accordingly reduced estimates of the natural population increase. 

For all the noises about slowing permanent migration to Australia, including 'temporary' migrants net overseas migration actually accelerated again to +250,000 over the year to March 2019. 

Some clever sleight of hand there, though I doubt the congested capital city electorate is too much fooled! 


Net overseas migration shifted a little more towards Queensland and Western Australia over the year to March, despite being still heavily dominated by immigration to Greater Sydney and Greater Melbourne. 

Tasmania attracted +1,000 newly immigrated Aussies in the first quarter, too, which is an unusually high number for the Apple Isle, and indeed the highest figure on record!


Interstate migration away from New South Wales, South Australia, and Western Australia has slowed, but Queensland continues to attract +13,000 a year away from the southern climes in particular.


This makes south-east Queensland relatively speaking a population growth powerhouse, with the state growing at about +89,000 per annum.


Overall, New South Wales (+114,000) and Victoria (+133,000) attracted the strongest annual population growth, while several other states are steadily increasing, including Tasmania, Western Australia, and the very liveable South Australia.

The Northern Territory population is in a troubling decline, and since for some reason my chart doesn't have a negative y-axis, you can't see that the Top End recorded -1,100 for the year to March. 2019. Ouch!


Overall, the lag in processing births will see the rush to an Aussie population of 25½ million pushed back by a few weeks, at least according to the official estimates. 

But the big picture is unchanged, which is to say accelerating net immigration and population growth running at around +400,000 per annum.


Big numbers, indeed, and with dwelling starts in an ongoing decline, more than enough to clear the new apartment glut in time. 

Thursday, 19 September 2019

Will we see rising inequality?

Getting ahead

See here for the answer (or click on the image below):


Unemployment ticks higher

Defying gravity (for now)

Employment continued to defy gravity in increasing by +34,700 in August, although the composition was was all part-time this month, and full-time employment fell. 

Over the year to August employment increased by +310,700 to keep the annual pace of growth at a sprightly +2.46 per cent (a rate of increase still well ahead of population growth). 


The jobs over the past few months have mostly been seen in New South Wales and Victoria (still), although hearteningly Western Australia has now recorded several solid months on the bounce.

Employment in the Northern Territory, by way of contrast, has fallen by nearly 7 per cent from its peak. 


Participation in the labour force continues to skyrocket, now up to a fresh high of 66.2 per cent - once again driven by New South Wales and Victoria - and as such spare capacity is as high as it ever was.

With another modest increase to 5.254 per cent, the monthly unemployment rate was rounded up to 5.3 per cent.

The unemployment rate is now at the highest level since July/August 2018 and seemingly destined to drift ever further away from NAIRU. 


On the plus side, in New South Wales the unemployment rate ticked down to 4.3 per cent, and Western Australia's seasonally adjusted unemployment rate has been under 6 per cent for three months in a row now.

On the other hand, unemployment rates are far too high in Queensland (6.4 per cent), Tasmania (6.6 per cent), and South Australia (6.8 per cent), all running at well above 6 per cent.

The smoothed trend state unemployment rates are plotted below, showing the dichotomy:


The quality of jobs in Australia remains a critical issue, with the growth in hours worked only +1.7 per cent over the year to August.

Note that this means employees are working fewer hours, on average. 


The wrap

Summarily, still lots of part-time jobs are being created, but the leading indicators include job advertisements falling at dire double-digit rates, and a construction-related crunch heading squarely for Sydney and Melbourne. 

Measures of underemployment increased again, and under-utilisation (13.8 per cent) remains very much elevated (and almost off the charts for younger workers at around 30 per cent), and so wages growth remains slow. 

It's good that more people are in work, and the Federal budget is now back in balance.

But there remains a ton of spare capacity, inflation expectations continue to sink, and economists are lining up to call for an interest rate cut in October (markets are pricing 25 basis points in October as close to a lock, at about 80 per cent). 

Of course, jobs reports are always 'mixed', but recent releases really have been mixed!

The two most populous states have recorded strong employment growth and conditions, but with participation so high objectively we're now a long way from full employment, and - with construction job advertisements cratering - likely heading further adrift.

Jobs leading indicator sinks for 16th month

Leading indicator slumps

The Department of Employment's leading indicator of employment fell for a 16th (sixteenth) consecutive month in September. 

Cyclical employment has now fallen for a second month too, as the cycle rolls over:


Source: Department of Employment

Employment figures have continued to confound on the upside, but it's hard to see how that continues given the outlook for economic activity. 

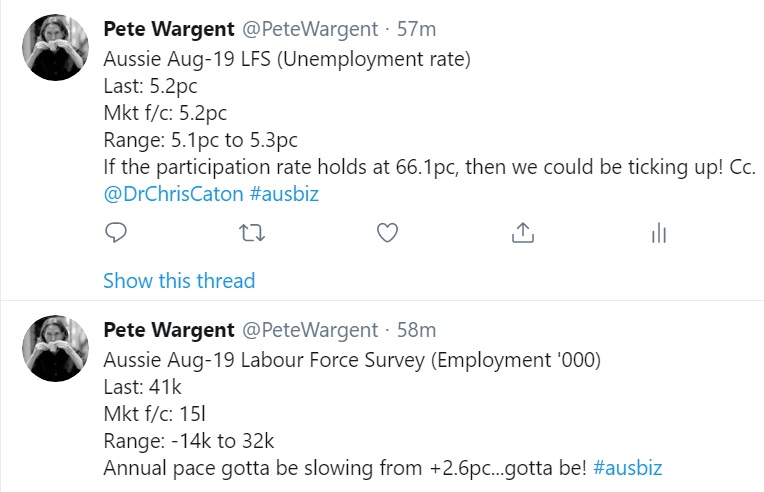
Anyway, here's what the market expects from today's Labour Force figures, which is to say employment growth of +15,000 and the unemployment rate flat at 5.2 per cent (a long way from NAIRU, which is thought to be around 4½ per cent or perhaps lower): 


Expect we'll see more sluggish growth in hours worked, whatever the headline result.

Charts later!