Wednesday, 5 January 2022

Carry on up the charts

Fixed rates on the rise

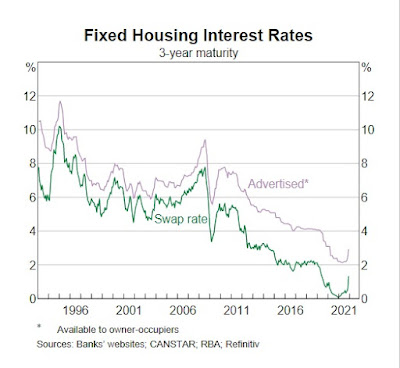
Nothing 'new' here, as such, but some interesting chart on fixed and variable mortgage rates from the Reserve Bank.

Fixed mortgage rates are now on the rise, and quite sharply...

Variable rates, on the other hand, are not...
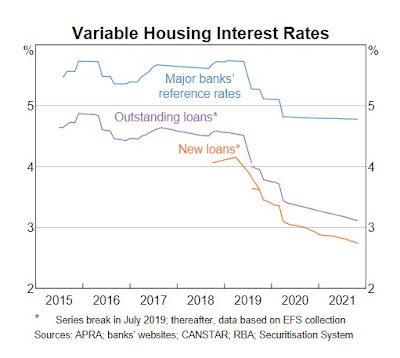

Finally on the subject of interest rates, if you haven't done so already, it would possibly be smart to speak to your mortgage broker about refinancing given the marked shift in mortgage rates over the past couple of years!
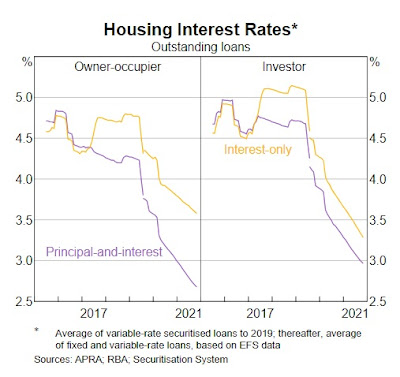

You can track down the full RBA Chart Pack here - with some very interesting insights, as always. 

---

Spending returns in Q4

Separately from APRA, housing investment loans are now back up to where they were a few years ago.

Lending to owner-occupiers still had some life in November, increasing by a relatively strong 0.9 per cent, with investment lending up by a more modest 0.3 per cent. 
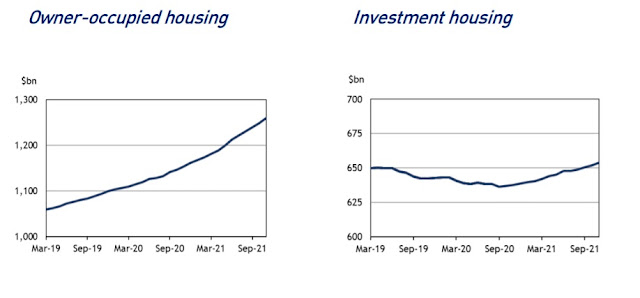

Source: APRA

While CBA has been gaining mortgage market share, ANZ has continued to struggle with a blowout in mortgage processing times. 

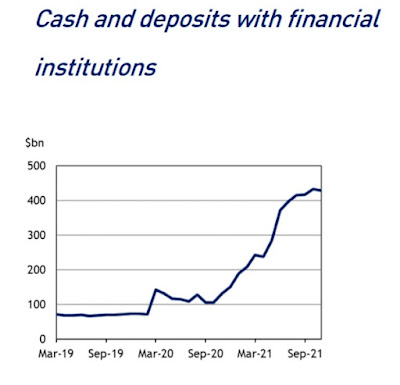
Following an unprecedented surge. cash and deposits with financial institutions have finally begun to run down, declining by about $5 billion or 1.2 per cent in November. 

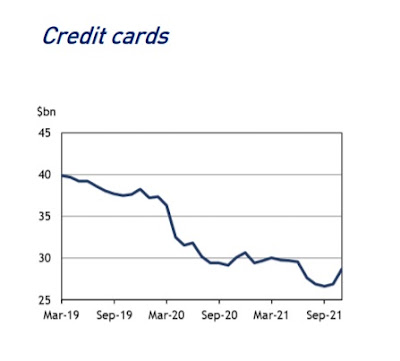
And there was also some sign of credit card activity bouncing, with lending up 6 per cent in November, suggesting that households were beginning to spend again before Xmas, reflecting the easing of restrictions and improved economic conditions, according to APRA. 

Despite this, credit card lending remains well below historical averages. 

The full statistical release from APRA can be found here

Makes a nice change from reading about antigen tests anyway.

Tuesday, 4 January 2022

Listings fell back in December

Listings decline

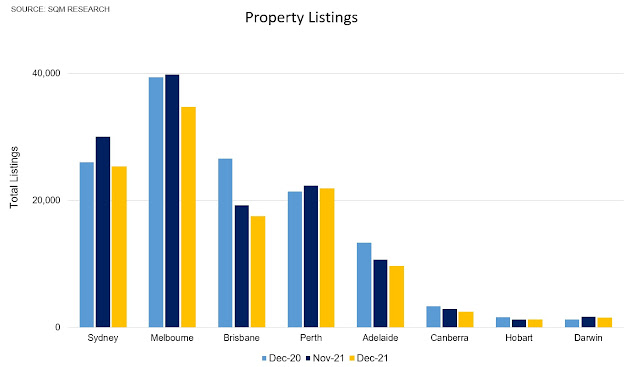
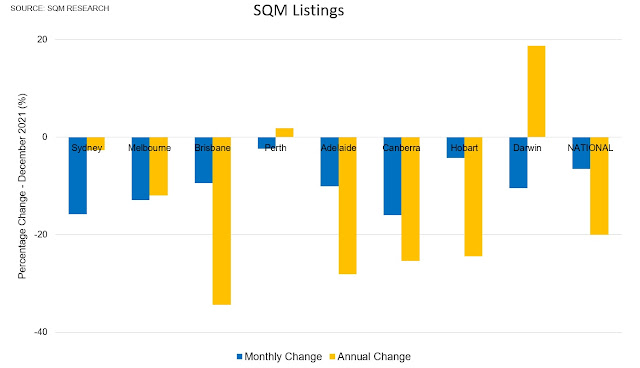
Listings dropped from 233,716 to 218,415 for a decline of -6.5 per cent in December, according to SQM Research.

The decline was led by sharp falls in Sydney, Melbourne, and Canberra, and listings were some -20 per cent lower than a year earlier (when there were 272,999 listings). 


Brisbane listings were -34 per cent lower than a year earlier, and there were also sharp declines in Adelaide (-28 per cent), Canberra (-25 per cent), and chronically tight Hobart (-24 per cent).

Darwin was the only capital city to see listings rise significantly over the year. 


According to Louis Christopher from SQM Research, overall there remained a shortage of listings at the national level in December, and as a result asking prices increased over the month. 

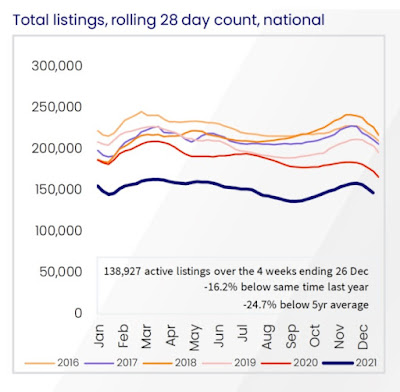
Separately, CoreLogic found listings to be -25 per cent below their 5-year average. 


Source: CoreLogic

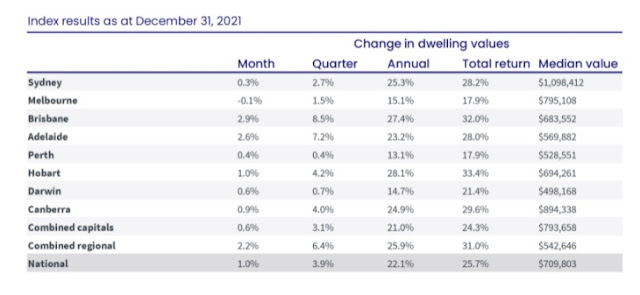
Over the calendar year, CoreLogic reported dwelling prices up 22 per cent, but with the rate of growth generally slowing in the capital cities towards the end of the year. 


Source: CoreLogic

Older stock is clearing

New listings fell -47 per cent in Sydney in December as vendors pulled up the ladder.

And aged listings over 180 days fell in half from a year earlier, in a sign that old stock is still clearing. 

Overall, there was no real sign of panic selling in the latter stages of the year.

On the contrary, quite an optimistic outlook beckons for property in 2022. 

---

You can find SQM's detailed release here

Monday, 3 January 2022

Pandemic migration, and the resilience of cities

Demographic trends

There were some notable demographic shifts in 2021, away from density, and away from the most locked down states, and not only in Australia. 

I took a look at some related thoughts here (or click on the image below):


Saturday, 1 January 2022

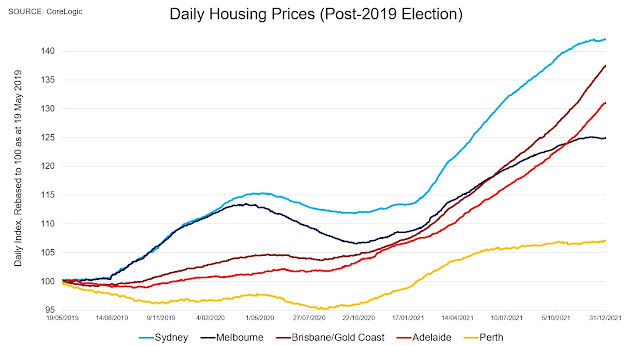
Melbourne house prices eased in December

Calmer waters

Melbourne house prices finished the month of December a little lower for the first time in 14 months, down by 0.3 per cent. 

Sydney prices also only increased modestly, to be up by 0.3 per cent.

Brisbane led the way with a significant 2.9 per cent increase in the month of December, for a thumping 8½ per cent quarterly rise.

Adelaide also recorded a strong monthly gain of 2.6 per cent, and house prices up by more than 7 per cent for the quarter. 

Perth recorded a 0.4 per cent monthly increase in prices. 


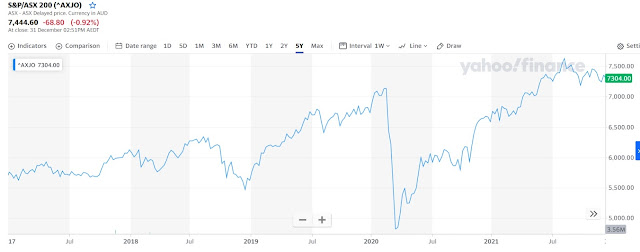
In the world of equities, Aussie stocks finished the year with an impressive 13 per cent gain, leaving the ASX 200 index higher than its pre-pandemic levels (and now about 12 per cent higher than the 2007 peak). 


Overall, then, household wealth has increased strongly in 2021.

The capital city house price index increased by around 21 per cent, substantially accounted for by Brisbane (28.4 per cent) and Sydney (25.3 per cent), as well as strong gains elsewhere. 

Superannuation funds have likely returned about 11-12 per cent for the calendar year, and stocks are clearly now well up from their 2020 lows.

Household wealth in Australia thus powered into the end of the year, probably exceeding $15 trillion, pushing the average net worth per capita up to a record high of around $575,000 (comfortably more than doubling over the past decade). 

Thursday, 23 December 2021

Credit growth hits pandemic high

Credit growth stronger

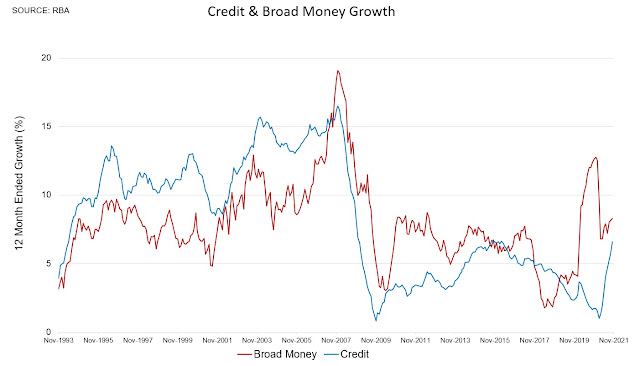
Credit growth in the Aussie economy picked up strongly to 6.6 per cent for the year to November, as business credit growth surged to 7.3 per cent year-on-year following a strong economic rebound on the reopening. 

Total credit growth in the month of November was 0.94 per cent, which is as strong as we have seen since all the way back in 2007.


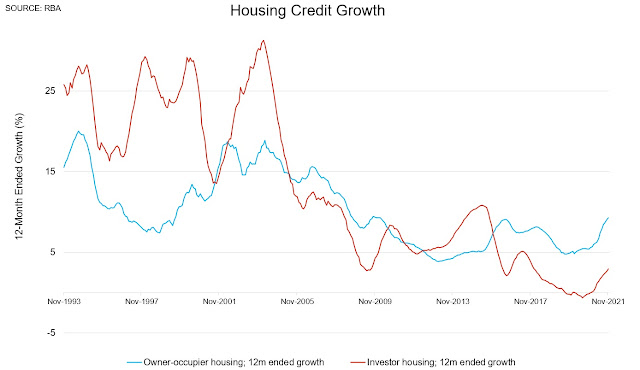
Annual housing credit growth increased from 6.7 per cent to 7.1 per cent in the month, but the pace of acceleration is now less steep. 


Investor credit growth increased a little, but only to 3 per cent, so expect to see some chronically tight rental markets in 2022. 


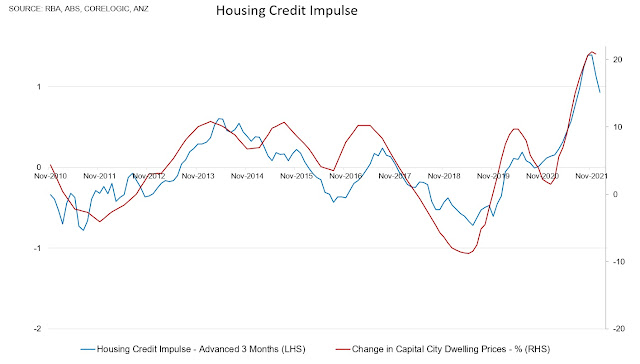
The impulse of housing credit growth continues to suggest that housing price growth will cool imminently; in fact we should already be seeing this in the December numbers. 


It's partciularly pleasant to see business credit growth picking up, to the highest level in half a decade. 

Wednesday, 22 December 2021

Skilled vacancies strong; hiring blitz ahead

Vacancies highest since 2008

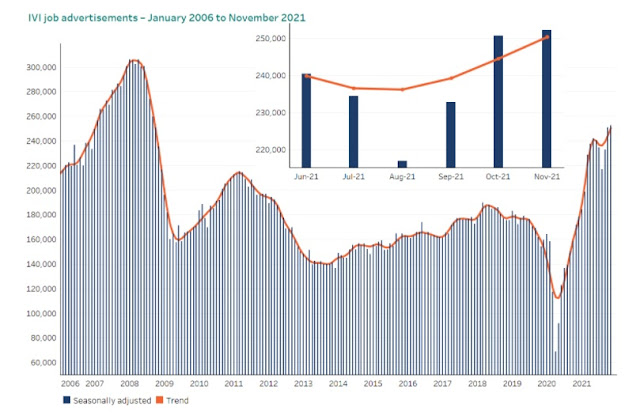
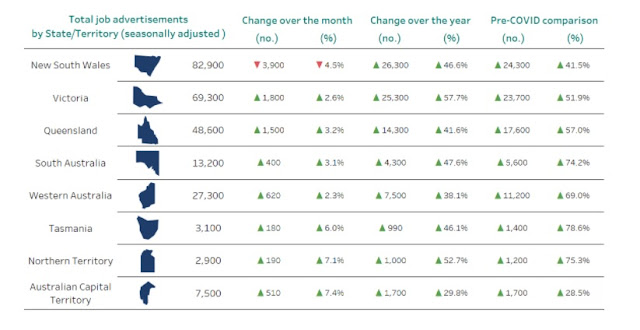
The Department of Employment released its latest job vacancies figures up to November, and they were still running at high levels, with advertisements increasing to a seasonally adjusted 252,300, to be more than 50 per cent higher than pre-COVID levels.


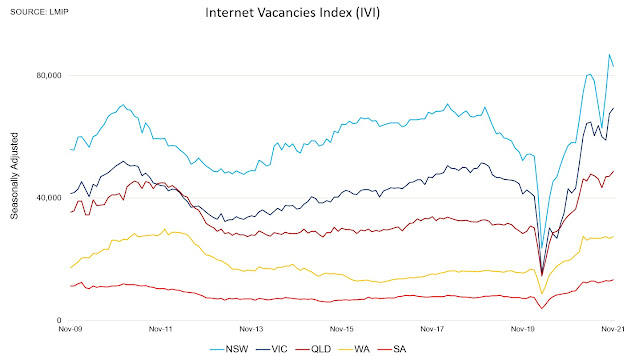
New South Wales saw vacancies drop 4.5 per cent in November, but there were increases everywhere else. 

Source: LMIP

This poses the question as to what happened in New South Wales in the month.

One possibility is that many roles were filled in a reopening hiring surge. 

Just as likely, the numbers were just normalising from extreme and unprecedented highs in NSW. 


In any case, over 250,000 vacancies is a strong figure indeed, and the highest since 2008.

This suggests that if Australia can hold its nerve and successfully manage a sensible reopening we should be in for a hiring blitz in 2022.

Monday, 20 December 2021

New podcast: How to invest for your future (Michael Pascoe)

New podcast

This week on the podcast I spoke to the legendary Michael Pascoe, on the subject of how to invest for your future, and much more.

Tune in here (or click on the image below):


You can also tune in at Spotify, or Apple, or even YouTube...


Enjoy!

Sunday, 19 December 2021

Household wealth pushing $14tn...but wages still slow

Wealth effect

The Aussie stock market looks set to finish the second half of 2021 broadly speaking at the same level as it was at around 30 June, after a strong first half to the calendar year.  

Property prices have had a strong run, up 22 per cent in the capital cities over the year to September, and superannuation balances have continued to grow. 

Net of all liabilities, total household wealth increased sharply in the September quarter from $13.3 trillion to $13.9 trillion.

Which when spread across approximately 10.7 million households equates to a mean or average wealth per household of just shy of $1.3 million.


There was only a modest increase in debt and liabilities over the year to $2½ trillion, so the ratios people used to watch with interest like debt to assets and debt to equity are now very low (albeit almost never reported). 

The average net worth per capita also increased by around 20 per cent over the year to September from $450,000 to to $540,000.

This was roughly equivalent to the annual change in dwelling prices, and the fastest pace of increase in the dozen years since the rapid rebound from the global financial crisis panic. 


Excess savings pile up

Household currency and deposit balances had ballooned to a massive $1.4 trillion by September, with something like $240 billion in excess savings piled up through the pandemic shutdowns, according to CBA economist estimates. 

This suggests that, if Australia can manage to successfully remain open, the combination of the wealth effect plus record balances sitting in liquid accounts should drive a powerful rebound in the consumption economy. 

Unfortunately wages growth - on average - remains slow, so the wealth effect has only been seen for those with substantial superannuation balances, stock positions, and homes, rather than spread across all Australians. 

This will be a point of focus in 2022 and beyond: can wages growth ever get back to 3½ per cent, or higher?